The Relacart production base in Enping, Guangdong - 5,000 m2 across two self-built R&D and production buildings, with photovoltaic panels covering the roof.
A specification is a promise about physics, and physics does not care what a brochure says. Sensitivity, signal-to-noise ratio, total harmonic distortion and frequency response can only be stated honestly if somebody measured them under controlled conditions - which means the room, the instruments and the procedure matter as much as the radio itself.
Most buyers never see that side of the industry. They compare two datasheets, notice that one claims S/N > 105 dB and the other claims 108 dB, and have no way of knowing whether either number was measured in a proper chamber or read off a marketing template. This article walks through the measurement chain behind our own spec sheets - the same chain you are implicitly trusting when you compare numbers. If you have already read our guide to reading a wireless microphone datasheet, consider this the view from the other side of the bench.
Why a Normal Room Cannot Measure a Microphone
The first problem is acoustic. A microphone capsule is a pressure sensor, and any ordinary room is an echo chamber: sound reaches it directly from the source and again - milliseconds later and phase-shifted - off the walls, ceiling and floor. Measure frequency response that way and you are measuring the room as much as the capsule. Reflections of only a few milliseconds are enough to produce comb-filtering ripples of several decibels across the response, which is larger than the tolerances professional datasheets quote.
The second problem is noise. Sensitivity and signal-to-noise measurements need a known, quiet acoustic input. An office floor has HVAC rumble, traffic, compressors and voices - all of it lands in the measurement. This is why serious acoustic testing happens in a fully anechoic chamber: an isolated room whose walls, ceiling and floor are lined with deep wedge absorbers, so the microphone sees only the direct sound from the test source and nothing else.
Inside the chamber, calibrating acoustic characteristics such as sensitivity and directivity becomes possible with real accuracy. Environmental noise interference is eliminated, and key audio parameters can be acquired and tested cleanly. Without this room, a "sensitivity" figure is an estimate; with it, the number means the same thing today, next month and on a different production line.
The Acoustic Bench: Turning Sound Into Verified Numbers
Professional audio analyzers verify whether the signal-to-noise ratio and frequency response of a finished transmitter actually meet the standard. The procedure is deliberately unglamorous: the transmitter is fixed in a fixture at a calibrated distance from a reference source, fed test tones and swept signals, and its demodulated output is compared against the input at every frequency.
The numbers this produces are the ones datasheets quote. Our UR-2Q quad-channel receiver, for example, is specified at 96 kHz / 24-bit audio sampling with S/N > 105 dB, T.H.D < 0.7% at 1 kHz and a frequency response of 80 Hz - 18 kHz within ±3 dB. The UR-280 dual-channel platform pushes the same figures further: S/N > 110 dB, THD < 0.5% and a 50 Hz - 18 kHz response within ±1 dB. Each of those claims is a statement about what a specific measurement setup returned - and each one can be re-verified on any unit that leaves the line.
The same bench discipline applies to deviation and sensitivity. A handheld transmitter such as the UH-222 specifies ±45 kHz deviation and a sensitivity figure quoted at a defined input level and deviation, because sensitivity measured under undefined conditions is meaningless - a point we covered in detail in the datasheet guide.
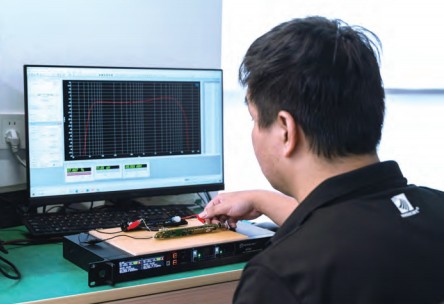
Audio analysis software measuring a transmitter while it works: the response curve is captured live, not read from a design document.
The RF Bench: Where Frequency Stability Is Earned
Wireless performance is measured with a different set of instruments. Spectrum analyzers check radio frequency stability - whether the carrier sits where the display says it sits, whether it drifts with temperature, and whether the transmitter radiates anything it should not, such as harmonics or spurious emissions outside its assigned channel.
Frequency stability is quoted on our datasheets with an unusual degree of precision: the UR-2Q and HR-32D receivers are both specified at ±0.005%, with the HR-32D holding that figure across a -10 °C to 50 °C operating range. That number is only credible if the product was actually cycled through temperature and measured at the extremes - which is exactly what temperature chambers are for. A receiver that meets ±0.005% at room temperature but drifts on a hot stage truss has not met the spec; it has met the spec in a comfortable office.
Circuit-level testing completes the RF picture. Oscilloscopes, LCR meters and RF counters test boards under varied loads and environmental conditions to assess stability before assembly ever reaches a finished unit. On the production side, an in-house developed wireless microphone test system executes more than 30 test items per receiver - current draw, antenna power, operating frequencies, audio curves and more - producing objective data to evaluate operational stability rather than a pass/fail opinion.
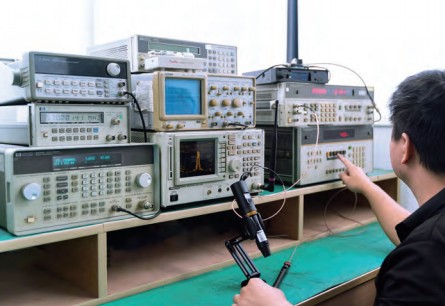
The RF test position: spectrum analyzers and reference receivers verify carrier stability, spurious emissions and antenna power on every design.
Environmental Testing: Simulating the Year, Not the Afternoon
A wireless microphone that works on the bench and fails on tour is a defective product regardless of its datasheet. Professional gear spends its life being carried, dropped, stacked, chilled on a truck overnight and baked under stage lights. Environmental testing exists to compress those years into days.
Temperature chambers cycle products through heat and cold; abrasion testers wear at the surfaces users actually touch; drop tests simulate the trip from road case to floor. Surface parameters - hardness, gloss, colour fastness - are checked alongside the mechanical trials, because a transmitter whose finish fails looks like a counterfeit within months, whatever its electronics are doing.
The principle behind all of it is simple: endurance is a spec, even though no datasheet prints it as a number. The products that survive this stage are the ones whose "operating temperature" line means something.
Quality Starts Before Assembly: Batch-by-Batch Material Inspection
None of the above matters if the components going into the build vary between batches. Raw material inspection therefore treats incoming parts the way finished-product QC treats completed units: key raw materials undergo batch-by-batch inspection for traceability verification, and a dynamic supplier screening mechanism keeps vendors whose consistency slips out of the chain.
Production itself runs under a full-process quality regime combining automated inspection with manual multi-point checks, so that consistent, stable equipment quality does not depend on the vigilance of one particular operator on one particular shift. This is the same philosophy we described from the buyer's perspective in the factory audit checklist - the difference here is that you are seeing the supplier's side of the same discipline.
Complex sound field environments are also simulated during development and QC, so that reliability is evaluated in conditions that resemble real venues rather than only in the calm of the chamber.
What a Buyer Should Do With This Information
The practical takeaway is a short list of questions that separate measured specifications from aspirational ones. First: which instrument produced this number, and in what environment - an anechoic chamber or an ordinary room? Second: at what temperature range does the frequency stability figure hold? Third: can the supplier produce a per-batch test record for the units being shipped, not just a type-approval certificate from five years ago? Fourth: does the factory run environmental tests on finished products, or only on a design sample once?
A manufacturer with a real measurement chain answers these questions without hesitation, because the answers are its daily routine. A trading company answers them with silence or with another brochure. Certification documents matter too - our overview of wireless microphone certifications and compliance explains which documents prove what - but certificates attest to a moment in time, while measurement discipline is what keeps every subsequent unit conforming.
That is ultimately what an anechoic chamber represents: not a piece of equipment, but a commitment that the numbers a buyer reads are the numbers a buyer gets.
Why is an anechoic chamber necessary for microphone testing?
Ordinary rooms reflect sound, and those reflections reach the microphone milliseconds after the direct signal, producing phase cancellation that distorts frequency response and sensitivity measurements. An anechoic chamber absorbs reflections completely, so the capsule sees only the calibrated direct sound from the source - making the measurement repeatable and trustworthy.
What does the automated receiver test system check?
More than 30 items per unit, including current draw, antenna power, operating frequencies and audio curves. Automating the sequence means every receiver gets the same objective treatment, and the recorded data can be traced back if a field issue ever appears.
How does temperature testing relate to the numbers on the datasheet?
Figures such as frequency stability are only meaningful across the stated operating range. Cycling finished units through temperature chambers verifies that the specification holds at the extremes, not just at the comfortable room temperature where prototypes were developed.